From 75 to 99: hunting a 71-second LCP (and bumping Accessibility from 85 to 96)
Performance 75 → 99 and Accessibility 85 → 96 on a Next.js 16 marketplace. The 71-second LCP, the traps that cost me hours (a stale build running in parallel, CPU contention), and why a single unoptimized `<img>` made all the difference.
A real Lighthouse optimization session on a Next.js 16 marketplace — real debugging, 3 traps that cost me time, and why a single <img> made all the difference.
The setup
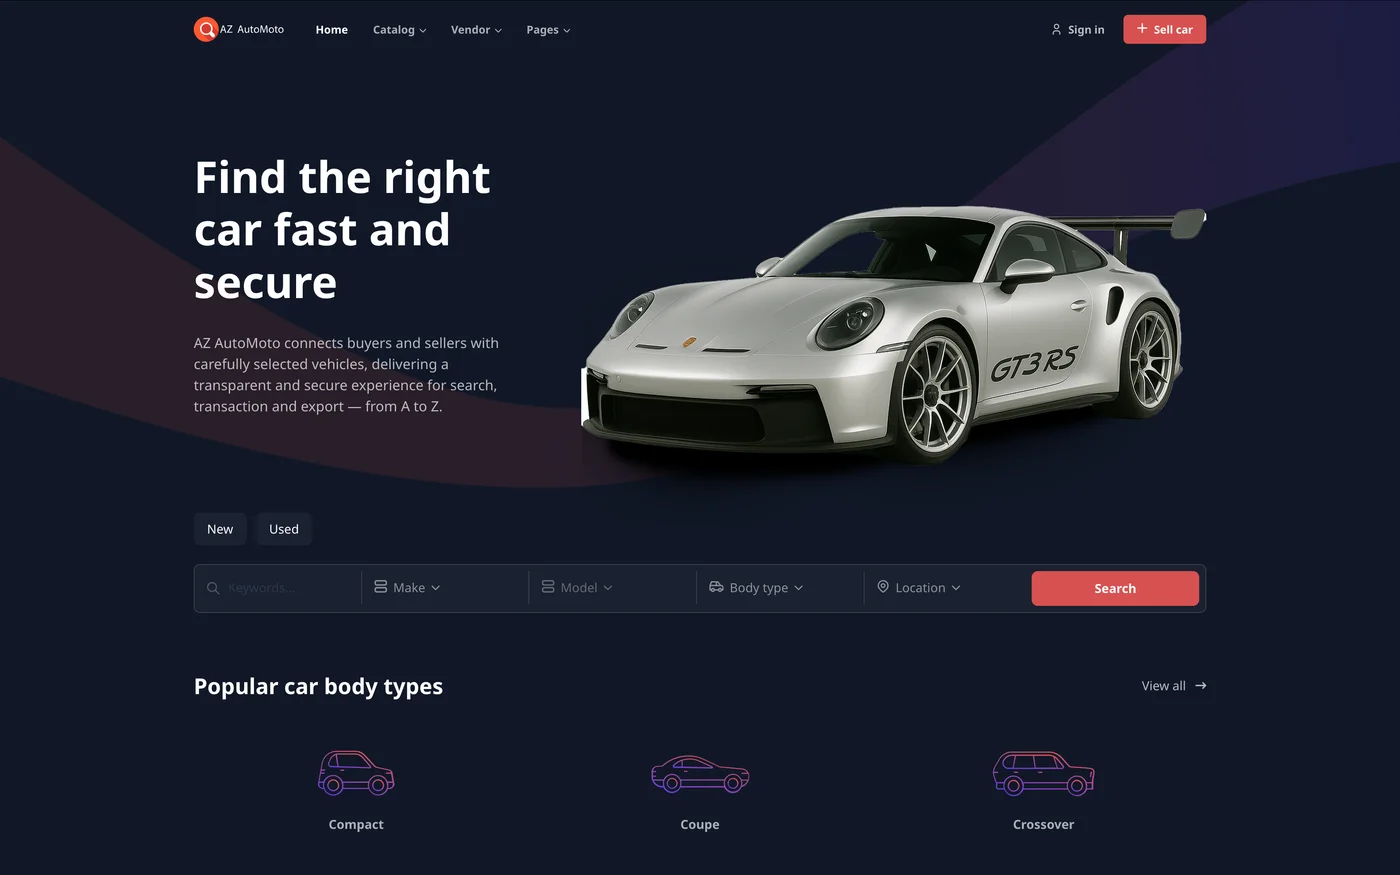
I was rewriting a used-car listings marketplace from CakePHP to Next.js 16 (App Router, MongoDB, images in public/). Functionally it all worked. SEO and Best Practices — 100. But Performance was below 90 and Accessibility at 85, and I refused to ship like that.
Goal: 90+ on Performance and 95+ on Accessibility in production — not just "works on my machine".
Part I — Performance: hunting the LCP
Trap #1: never measure performance in dev
The first mistake everyone makes: run Lighthouse against next dev and panic.
Dev mode in Next is deliberately unoptimized: no minification, React in dev mode (double-render, warnings), Turbopack overhead, no cache headers. Performance in dev is always 60–70, no matter how good your code is.
Rule: measure on a production build (next build && next start), the closest proxy to remote.
pnpm build && PORT=3100 pnpm start
npx lighthouse http://localhost:3100/search/cars --only-categories=performance
Result on the production build: Performance 75. Still below 90. So it wasn't just dev — there was a real problem.
Contradictory metrics = artifact smell
I looked at the breakdown:
| Metric | Value | Score |
|---|---|---|
| First Contentful Paint | 1.0 s | 🟢 100 |
| Largest Contentful Paint | 64.4 s | 🔴 0 |
| Total Blocking Time | 90 ms | 🟢 99 |
| Cumulative Layout Shift | 0 | 🟢 100 |
| Speed Index | 2.1 s | 🟢 99 |
Hold on. Speed Index 2.1s — the page filled visually in 2 seconds. But LCP says 64 seconds? And the LCP element was an <h3> (text, not an image).
When metrics contradict like this (great FCP/SI, absurd LCP), it's not "slow code" — it's something blocking the page from stabilizing. A resource taking forever to load.
The culprit: a raw <img> serving 2.5MB PNGs
curl -s http://localhost:3100/search/cars | grep -oc '/_next/image'
# 0
Zero /_next/image hits. Images weren't going through Next's optimizer. They were served raw:
<img src="/uploads/galleries/3317f641....png" />
How heavy were the originals?
ls -la public/uploads/galleries/*.png # ~2.5 MB / image
The listing card used a raw <img>, not next/image. The catalog has ~12 cards × 2.5MB = ~30MB of unoptimized images. Under Lighthouse's 4× CPU throttling, loading them took tens of seconds → LCP exploded to 64s, while text (FCP) appeared instantly.
// before
<img src={listing.image} className="h-full w-full object-cover" />

// after
<Image src={listing.image} alt={listing.title} fill
       sizes="(max-width:768px) 100vw, 25vw" className="object-cover" />
I converted the cards, the gallery on the car-detail page, and the homepage hero (another 1.6MB PNG). Decorative SVGs stayed as <img> — they're vector, next/image doesn't optimize them anyway.
Trap #2: I was measuring the OLD build the whole time
Rebuild, restart, re-measure:
PERFORMANCE: 71
LCP: 71.5 s
/_next/image: 0
Still 71 seconds. And /_next/image still 0. The source clearly had <Image>, but the HTML kept rendering the old <img> with the old className. It didn't connect.
lsof -ti:3100               # 72924 ← process from before the fix
tail -3 /tmp/prod.log
# port: 3100 is already in use
# Command failed with exit code 1
There it is. The server from the first measurement (pre-fix) hadn't stopped. pnpm start failed silently ("port in use"), and curl kept hitting the old build. All my "post-fix" measurements were on the old code.
Lesson: when you restart a server for a benchmark, verify the old one actually died. A
pnpm startthat fails doesn't stop you — it lets you benchmark ghosts for hours.
lsof -ti:3100 | xargs kill -9
pkill -9 -f "next-server"
Clean restart:
curl -s http://localhost:3100/search/cars | grep -oc '/_next/image' # 132 ← NOW it works
<img loading="lazy" decoding="async" src="/_next/image?url=...&w=640&q=75" />
The result
| Metric | Before (raw <img>) | After (next/image) |
|---|---|---|
| Performance | 71 | 88 |
| LCP | 71.5 s | 3.9 s |
| FCP | 0.9 s | 0.9 s |
| CLS | 0 | 0 |
A single fix — <img> → next/image — cut LCP from 71s to 3.9s.
The last mile: the LCP was lazy
The LCP image (the first card) was loading="lazy" — the browser deferred it on purpose. The fix: priority on above-the-fold images so they get preloaded.
{listings.map((l, i) => <ListingCard key={l.id} listing={l} priority={i < 4} />)}
Trap #3: the local score dances — it's CPU contention, not code
The score bounced between 70 and 88 on identical code. The clue: TBT swung between 60ms and 470ms. TBT (time the main thread is blocked) is pure CPU-bound — when it swings on identical code, it's the machine choking (dev + prod + build all competing on top of Lighthouse's 4× throttling), not the code.
And on remote? 99.
On Vercel, the things dragging us down locally vanish: image optimization at the edge (cached, not sharp running on-demand per request), zero CPU contention, CDN + HTTP/2 + Brotli. My prediction was 90+. Reality: Performance 99.
Part II — Accessibility: 85 → 96
Lighthouse flagged 5 categories. Four were straightforward; one required thinking.
Form labels, link names, heading order (easy)
- Inputs without labels (year/price/max-km sliders): descriptive
aria-label. - Icon-only links (Sign in with text
hidden sm:inline→ on mobile only the icon remains):aria-labelon the link. - Broken heading order (search:
h1→ straight toh3on cards): an<h2 className="sr-only">for the results section.
The contrast trap: a single red can't be both good on a button and as text
This was the interesting part. The brand used #d85151 for everything: button background (white text on top) and text (price, links) on a dark background.
The problem — neither passed AA (4.5:1):
white on #d85151:        4.03   (button — fail)
#d85151 on dark card:    3.99   (price text — fail)
And you can't fix both with one color: to pass white on red you need a darker red (#b83232); to pass red as text on dark you need a lighter red (#e06d6d). Opposite directions.
Solution — token split:
--color-primary: #e06d6d;   /* TEXT on dark — brightened, passes AA (5.0:1) */
--color-brand:   #b83232;   /* BUTTON background — darker, white passes AA (5.9:1) */
Then a surgical sed: the 21 bg-primary (buttons) → bg-brand, keeping the 52 text-primary on the new lighter red. The "Sold" badge the same way — --color-danger darkened to #c62828.
Touch targets (known limitation)
The only remaining audit: the dual-range slider thumbs overlap (two <input type="range"> with inset:0 over the same track). I bumped them to 24px, but Lighthouse also wants spacing between them — impossible by design when they share the same space. Reaching 100 would require redesigning the slider; I didn't think the last points were worth it.
Result: Accessibility 85 → 96.
Final scorecard
| Category | Before | After |
|---|---|---|
| Performance | 75 | 99 (remote) |
| Accessibility | 85 | 96 |
| Best Practices | 100 | 100 |
| SEO | 100 | 100 |
Takeaways
- Don't measure performance in
dev. Use a production build. - Contradictory metrics (good FCP, absurd LCP) = a blocking resource, usually an unoptimized image — not "slow code".
next/imageis not optional. A raw<img>serving a 2.5MB original is the most common LCP killer.priorityon the above-the-fold image.- Verify which server you're measuring. A silently failed
pnpm startlets you benchmark the old build for hours. - Unstable TBT = CPU contention, not code. Quiet the machine before drawing conclusions.
- Contrast sometimes needs a token split: a brand color can't be button background and text-on-dark at the same time. Separate them.
- Some audits have design limits (dual-range vs touch targets). Know when to stop.
A single <img> → next/image made the difference between 71 seconds and under 4. The rest was about not fooling myself along the way.
This is exactly the kind of work we do in SEO / AI-SEO audit & fix — real audit, fixes straight in code. See also SEO + AEO optimization or ongoing maintenance for Core Web Vitals monitoring.