
NO_LCP: how we took a cinematic site from failing Core Web Vitals to 91/100
A dark, animated, beautiful site — that failed the speed test with an “error”. The real story of a performance hunt: the black-screen mystery, the wrong bet, and the score that dropped exactly when we were fixing things. Ending: 91 mobile, 100 desktop.
The most counterintuitive thing I’ve learned optimizing a beautiful site is this: the more cinematic it is, the more it risks failing the speed test. Not because beauty is slow — but because the tricks that make it cinematic (fade-ins, intro screens, scroll animations) are exactly what confuses the engine that measures performance.
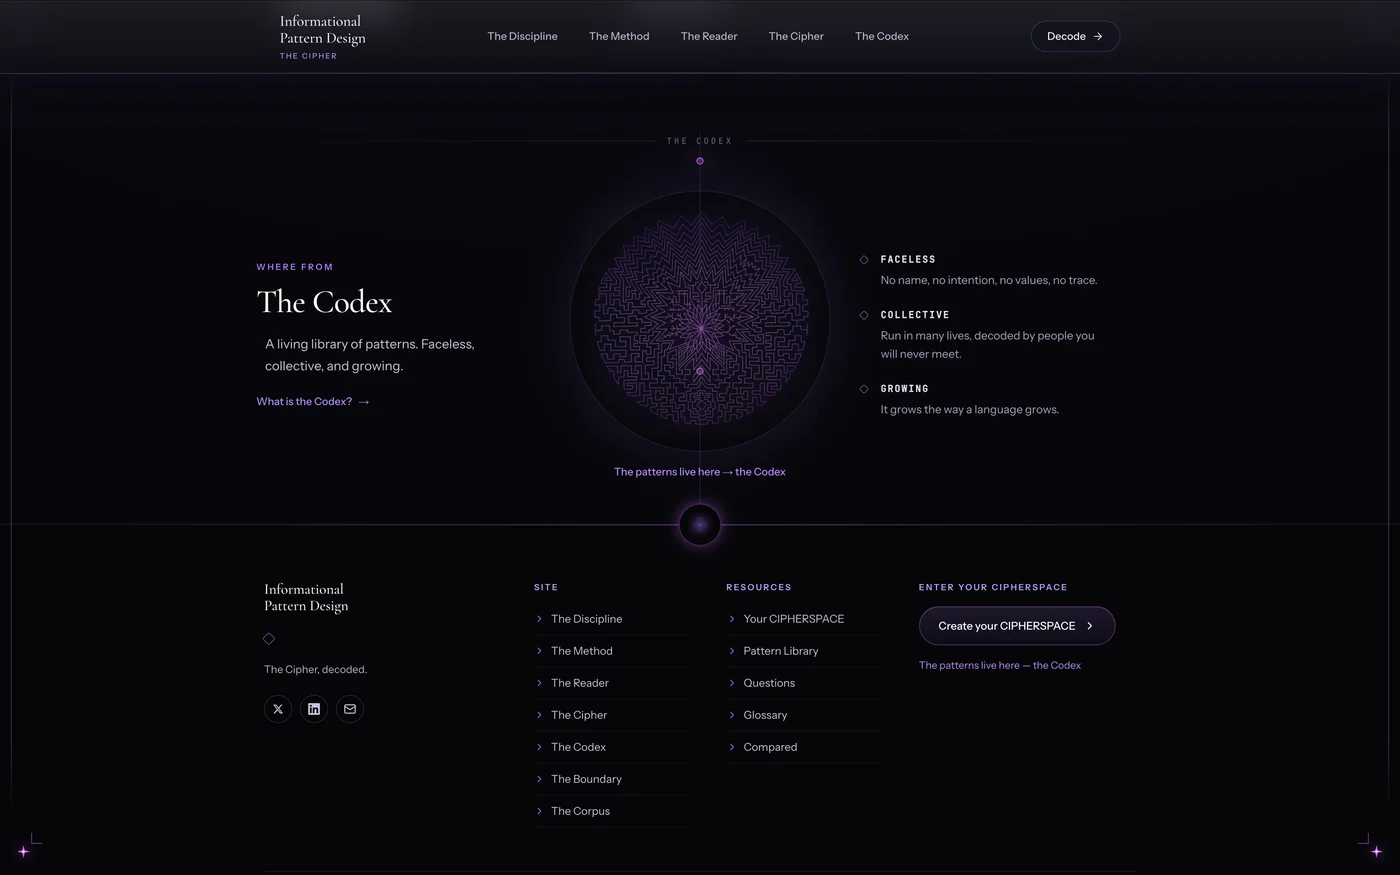
The site in this story is a dark, contemplative editorial, with a breathing mandala and an intro that dissolves into a “rain” of patterns. It looked flawless. And the first Google PageSpeed measurement returned, serenely: Error! NO_LCP. Not a low score. An error — the engine couldn’t find any “largest” element painted on screen.
This article is the hunt that followed. With all the real suspense: a mysterious black screen, a wrong bet, and the moment the score dropped exactly while we were fixing things. Ending: 91 on mobile, 100 on desktop.
Mystery 1: the black screen
NO_LCP means that, in the window where Lighthouse looks at the page, nothing “contentful” got painted — only black. Strange, for a site that obviously shows a huge title.
The cause, after digging: all content started at opacity: 0 and appeared through JavaScript, with 2–3 second delays, over a black transition “overlay”. Beautiful to the human eye on a fast laptop. But on a throttled mobile, the JS ran late, the delays stacked up, and Lighthouse closed the trace before anything appeared. Result: the engine saw a black rectangle and shrugged.
The fix wasn’t to remove the animation — it was to invert it. Instead of “everything invisible, then it appears”, we built an instantly painted intro screen (the title, server-rendered, visible from the first millisecond) that holds for a second and then fades out to make room for the animation. The large element is there from the start → the engine sees it → LCP registers. The fade-out happens after the measurement is already done.
NO_LCP → LCP 1.1 seconds. 95 on desktop. First win. The rule that stuck: an element that matters shouldn’t wait for JavaScript in order to exist.
Mystery 2: the wrong bet
The second site in the ecosystem passed desktop easily (98), but on mobile it scored 78, with a 5-second LCP. Red.
Here I made the classic mistake: I assumed. “It’s clearly that 400KB mandala in the hero.” I optimized it. I re-measured. The LCP… didn’t move at all.
The lesson, paid for with a wasted deploy: don’t guess the LCP element — measure it. I pulled from the Lighthouse report exactly which element was the “largest painted” and what was delaying it. And only then did the truth show: there wasn’t one culprit. There were four, stacked.
The four culprits (and why they were invisible)
- We were serving the same 900px / 400KB image on ALL screens — including a mobile where it displayed at ~400px. Zero responsive images. We were sending 2–3 times more pixels than fit.
- The wrong format. The framework (Next.js) served only WebP by default — not AVIF, which compresses a dense drawing 3–4 times better. It had to be enabled explicitly. Nobody had enabled it.
- A 182KB logo for an 18px icon. A 1024×1024 pixel file, loaded eagerly, in the footer, eating bandwidth exactly when the main image needed it.
- 320KB of fonts — loading an Eastern European character subset (ă, â, ș, ł…) on a 100% English site. Dead payload, plain and simple.
None of them shouted “I’m the problem”. Each seemed normal. Together, they choked the mobile connection and delayed everything. We solved them all: responsive images per screen, AVIF enabled, the logo optimized (182KB → 2KB), the dead subset stripped from the fonts. The page payload dropped from 948KB to 424KB.
The panic moment: the score that drops when you fix things
And here comes the adrenaline part. After all the fixes, we re-measure, full of hope. The score… drops. From 87 to 83. And the “Speed Index” had jumped to 13.8 seconds — ten times worse. Out of the frying pan, apparently.
The kind of moment where you start doubting everything you did. But the numbers didn’t add up: the LCP had actually dropped (4.0 → 3.2s), the image was now 32KB, the page lighter. How can “visual speed” be 14 seconds when everything is smaller?
The answer, after direct verification: an infrastructure red herring. The AVIF variant of the image was new — I’d just generated it. And the distribution network (CDN) composes it on the first request, on-demand, and AVIF encoding on a dense image takes ~8 seconds. That exact Lighthouse run hit the first generation and counted those 8 seconds as slowness. A tax paid only once. I fired a verification request: the second time, the image came in 0.2 seconds. Warm.
Re-run, with the warm variant: 91 on mobile. Speed Index back to 2.5 seconds. The panic had been a measurement illusion.
What remains, beyond the score
A site isn’t optimized through “less graphics”. It’s optimized through measurement discipline and understanding what each kilobyte pays for:
- Measure, don’t guess. A bad bet on the LCP element = a wasted deploy. The report tells you exactly which element and what’s delaying it — read it before you fix.
- The cheapest image is the one you don’t send at full size. Responsive + the right format (AVIF) cut 90% of the weight, without touching a single pixel of the original design.
- Know your defaults. AVIF was off in the config. A quality flag was silently ignored by the framework. The important things sat in unwritten settings.
- Dead weight hides — a font subset for a language you don’t use, a 1MB logo for 18 pixels, a 900px image for a 400 screen. None of them shout.
- A single measurement can lie. The cold-start of a new resource inflates a score and scares you for nothing. Verify warm before you draw conclusions — or break something in order to “fix” it.
Conclusion
We started from an error — a beautiful site that couldn’t be measured — and got to 91 on mobile, 100 on desktop, with the page at less than half the weight. Without sacrificing the breathing mandala, the cinematic intro or the contemplative darkness.
Performance and beauty aren’t in conflict. They just ask you to understand what the engine measures, how the effects confuse it, and where the weight hides. The rest is patience, a carefully read report, and the courage not to believe the first number that scares you.
See the projects behind the story too: The Cipher and Informational Pattern Design.
From the same series: How we cut 2 MB of invisible payload from thecipher.is — same library, different angle: the weight the page was sending without ever showing it.
Frequently asked questions
What does “NO_LCP” mean in PageSpeed? That the engine found no “Largest Contentful Paint” — no large element painted within the measurement window. It shows up often on sites where content starts invisible (opacity 0) and appears through JavaScript with a delay: on a slow mobile, nothing paints in time. The solution is to paint the main element instantly (server-rendered), not after JS.
Why did desktop pass but mobile fail? On desktop, the network and CPU are fast — even a heavy page loads instantly. PageSpeed tests mobile with throttling (slow 4G + slowed CPU), where every extra kilobyte and every second of JavaScript counts. Hence the 100 desktop / 78 mobile gap on the same site.
Why did the score drop right when I was optimizing? A cold-cache artifact. The new (AVIF) variant of the image was generated by the CDN on-demand on the first request — encoding took a few seconds, and that run counted the tax as slowness. On the second run, with the image already cached, the score jumped to its real value. The lesson: verify “warm” before drawing conclusions.
How much did the page weight drop? From 948KB to 424KB — under half. The biggest wins: responsive images per screen (not 900px on mobile), AVIF instead of WebP (compresses dense drawings far better), a logo optimized from 182KB to ~2KB, and removing an Eastern European font subset that was useless on an English site.
Can a site be beautiful AND fast? Yes — the two aren’t in conflict. We kept all the animations, the mandala and the cinematic intro, and reached 91 mobile / 100 desktop. The key is to understand what the engine measures (the large element, painted in time), to serve each image at the right size and format, and not to let dead weight (fonts, logos, variants) choke the connection.
Got a beautiful site that fails on speed? Get a quote — we measure first, then optimize, without touching the design. See our services too.